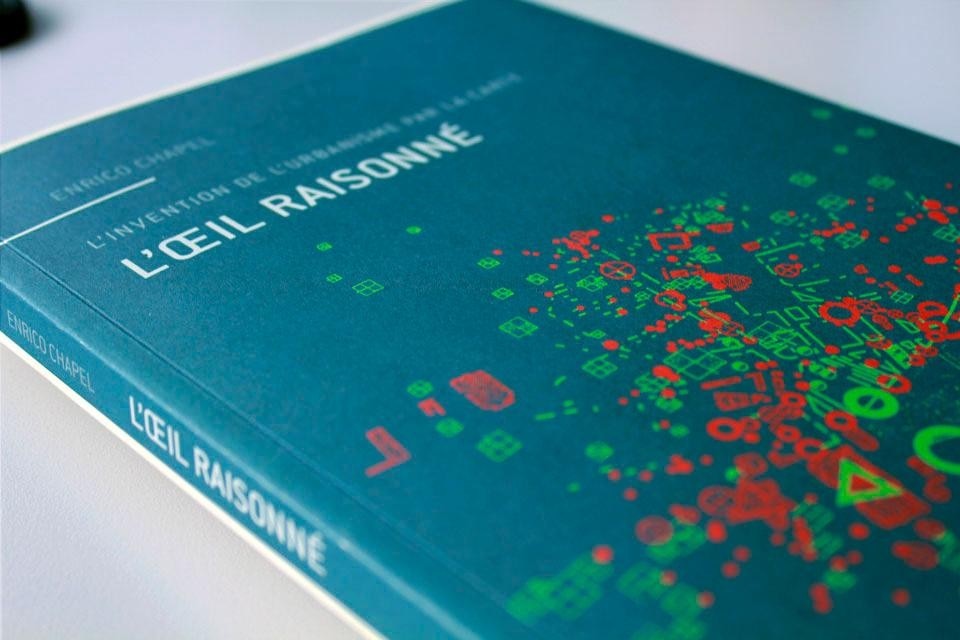
L'œil raisonné

Recounting key episodes that mark its history, the author shows how statistical analysis has been an essential tool for modern urban research.

L'œil raisonné. L'invention de l'urbanisme par la carte
Enrico Chapel, Metispresses, Geneva, 2010 (pp. 220)

If you want to see Paris, you should not walk the streets or climb the Eiffel Tower but rather go to the Hôtel Le Pelletier in Saint-Fargeau to see the documents that show the city's different functional systems such as population movements, land use, circulation, technological networks, the location of monuments and squares. At the beginning of his book, Chapel recalls the thinking of Poëte, who argued that the study of the city corresponds to a process of remote viewing of well-established and comparable facts in order to isolate and classify them and define their laws.

In the early 20th century, this approach to the reading of urban space lead to the establishment of a relationship with the city that was not given either from immediate vision or only from above (the view from an airplane, a bird's eye view), but was the result of a vision that can be called "oligottica" (Bruno Latour and Emilie Hermant, 1998). This vision is blind but connected, the opposite of "panoptic." It can evidence, through previously identified objects, a set of invisible phenomena providing their measurements and representing them through quantitative maps and statistics.
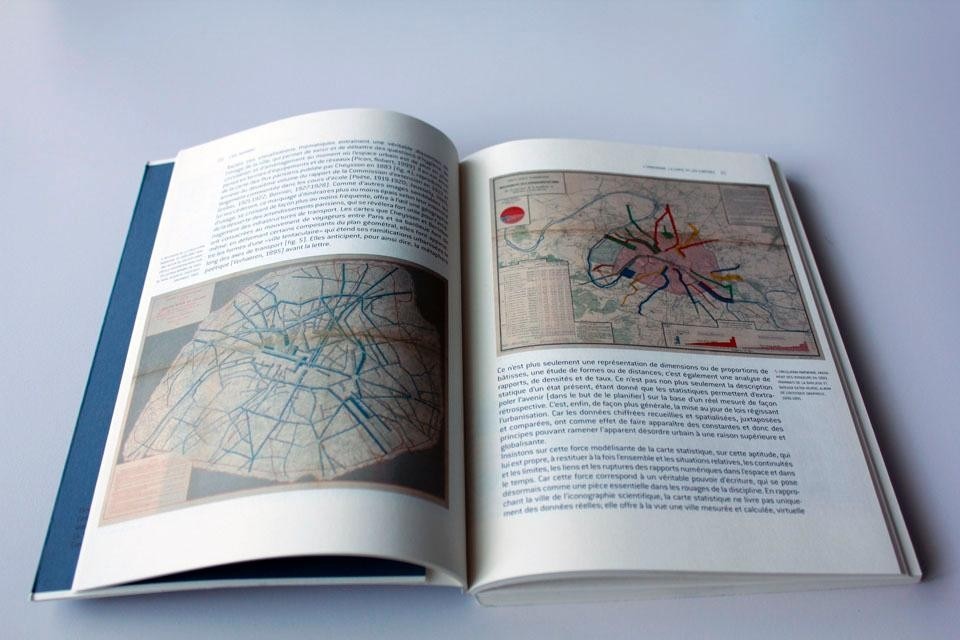
Interior spread from <i>L'œil raisonné: L'invention de l'urbanisme par la carte</i> showing two views taken from the <i>Album de statistique graphique</i> (1979-1899) of the transportation system in Paris in 1881-1882 (left) and 1889 (right).
Interior spread from L'œil raisonné: L'invention de l'urbanisme par la carte showing two views taken from the Album de statistique graphique (1979-1899) of the transportation system in Paris in 1881-1882 (left) and 1889 (right).
In the first half of the 20th century, the persistence of this kind of view of the city produced at least three different kinds of maps—and relative projects for the city—which describe a knowledge that, while changing and reorganizing itself according to different paradigms, produced a different vision of the city that is always standard, generic, neutral and uniform.

Enrico Chapel's research faces, from the historical point of view, the various evolutions and variations of this standard view by analyzing the production of quantitative images and maps, statistics, procedures of figuration in the context of urban and regional projects and policies during the first forty years of the 20th century, a period in which urban planning gained its independence through the definition of issues, the production of statements and operating procedures that sought a certain scientific basis.
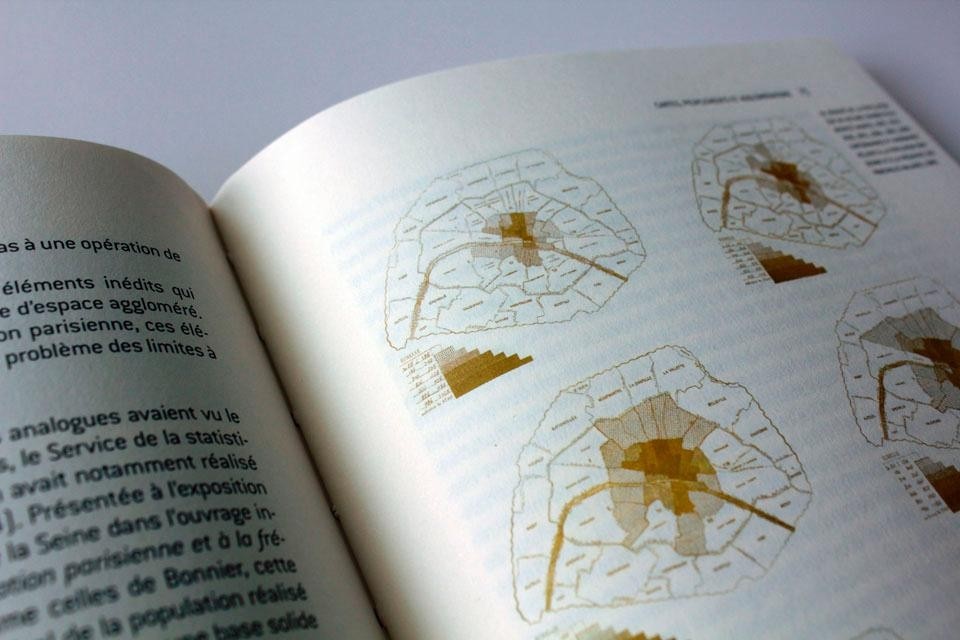
Cartographic series from the<i>Diagramme et relatifs à la population et à la parisienne et la fréquence des principales maladies à Paris</i> (1889), presented at the Universal Exposition of 1889. It shows the population density over the years (from left, clockwise) 1801, 1817, 1836, 1851.
Cartographic series from theDiagramme et relatifs à la population et à la parisienne et la fréquence des principales maladies à Paris (1889), presented at the Universal Exposition of 1889. It shows the population density over the years (from left, clockwise) 1801, 1817, 1836, 1851.
This retrospective look is an attempt neither to find the matrices of contemporary urban design nor to propose a new " critique of cartographic reason" (Franco Farinelli, 2009) much less to define the contours of some graphic semiology. The goal is to place the map within a perspective of the principles of the construction of planning knowledge because it is through this that changing urban discourse and the formation of its design and analytical objects can be understood.

This research is represented with cinematic logic in three different episodes whose leitmotif is the exploration of the role of quantitative cartography in urban planning practices. In the period under consideration, the author identifies three objects of study that continue to profoundly influence architects' imagination and practices: the urban agglomeration, the functional city and the neighborhood community.
The criticism of the standard image, the weakening of public action, and the attention to the qualitative dimension of space during the 1960s paved the way for the production of maps which today seek to understand the cultural and identity-related dimensions of space.
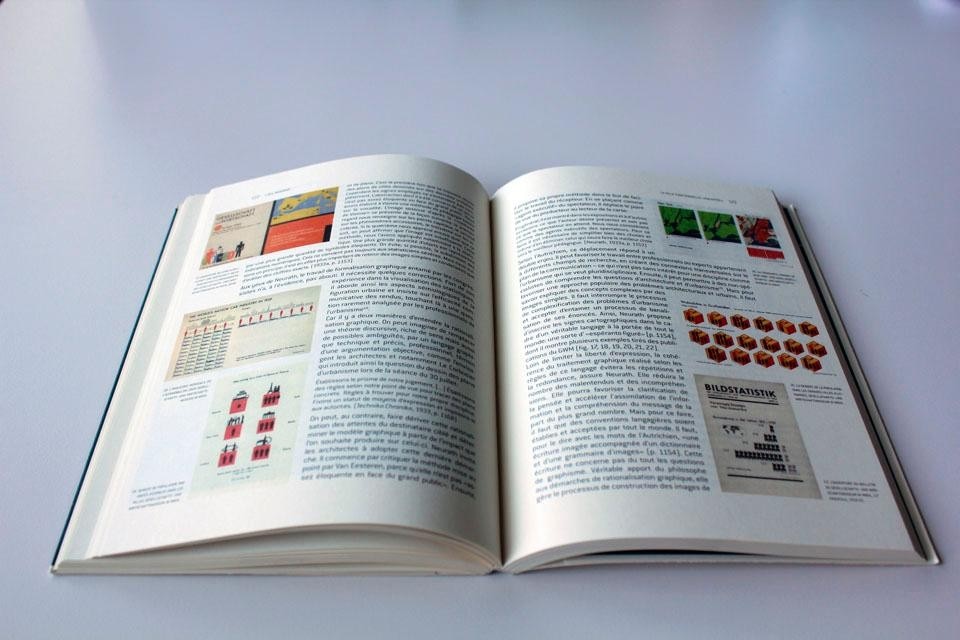
Reproductions of pages from publications of the Gesellschafts-und Wirtschaftsmuseum (GWM) in Vienna, where its director, Otto Neurath, created visual representations related to urban planning in a proposed universal symbol system.
The first episode concerns the story of the project for the growth of Paris by Marcel Poëte and Louis Bonnier in the early 1910s. In this work, the urban population is seen as quantity and its movements as the defining element of the project for the city's growth. The statistical measurement of population change and urban densities leads to the identification of averages; the concept of the planning "standard" (public services, infrastructure and areas that developers must provide by law as a planning obligation) appears and the project for the city's growth becomes one of equilibrium, the balanced distribution of the population on the regional scale.

The second episode describes the exchange of analytical techniques and design by networks of CIAM professionals during the 1930s in the context of the debate regarding the functional city. In these maps, representation takes on an active role through the production of abstract urban images designed to foster understanding of the relationship between urban form and functions and to identify spatial types: industrial, residential, commercial. The quantitative dimension plays an expressive role; the map becomes "infographic," the description of a purified city, filtering out its more difficult-to-manage aspects, reducing it to its functions and at the same time becoming a tool to support a project for urban space whose more conflicting political and social aspects have been neutralized.
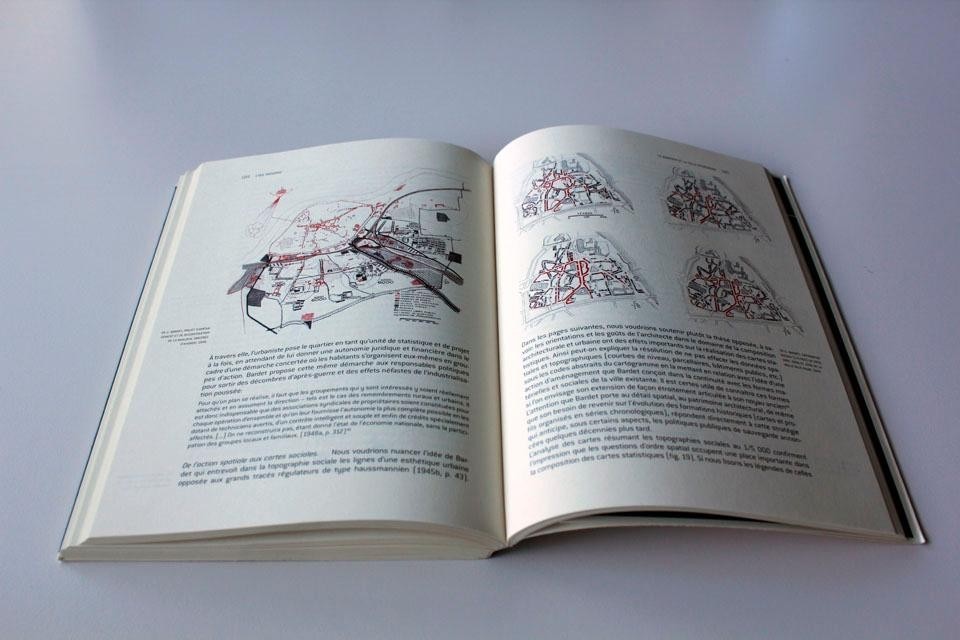
Interior spreads from <i>L'œil raisonné.</i> Left: G. Barted, reconstruction and development project destroyed on the outskirts of Avignon, 1946. Right: G. Barted, Social Topography (1 / 5000) in 1856, 1881, 1906 and 1936 of the old city of Albi, 1944.
Interior spreads from L'œil raisonné. Left: G. Barted, reconstruction and development project destroyed on the outskirts of Avignon, 1946. Right: G. Barted, Social Topography (1 / 5000) in 1856, 1881, 1906 and 1936 of the old city of Albi, 1944.
The third episode regards architect Gaston Bardet's cartographic production concerning the definition of the sociological profiles of cities in the context of the post-war reconstruction of French cities. Bardet's goal was to rebuild and configure balanced and harmonious urban spaces starting from the local community within a federative dimension that recalls bacterial colonies with their agglutinations and disseminations around lines of force and points of attraction.

The effort to turn quantitative mapping into an indisputable element supporting the project can be recognized insofar as it rests on the dual legitimacy of Science and State. The criticism of the standard image, the weakening of public action and the attention to the qualitative dimension of space during the 1960s (Henri Lefebvre, 1974, Michel De Certeau, 1980) paved the way for the production of maps which today seek to understand the cultural and identity-related dimensions of space. The effort is to capture distinctive elements and values, identified as new devices that can emphasize local diversity but which, unexpectedly, in the way they are read in design terms, often function as "uniforming" components of urban space.
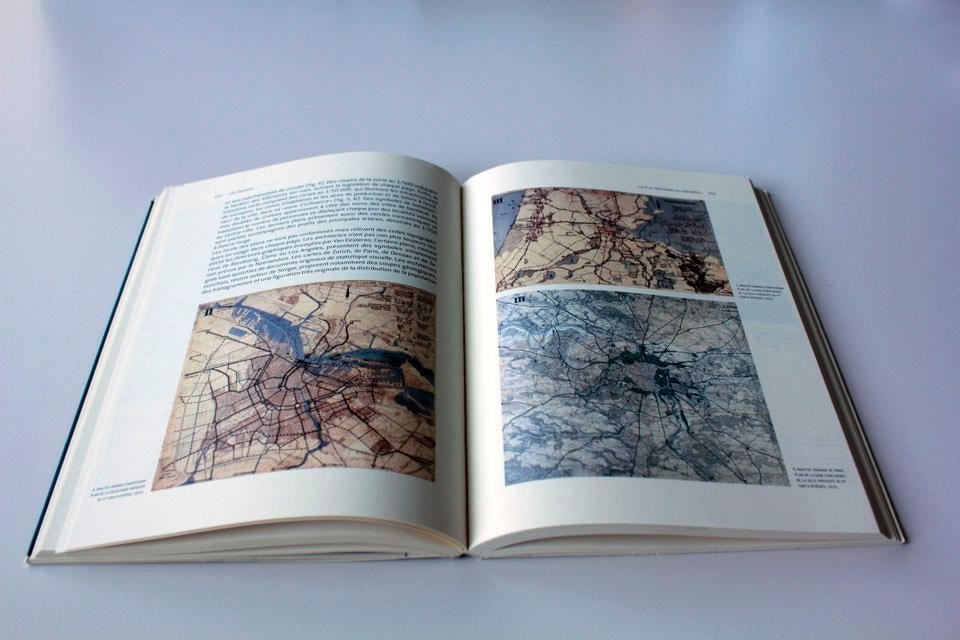
Interior spreads from <i>L'œil raisonné.</i> Images taken from analysis of urban Amsterdam and Paris, presented at CIAM IV, Athens, in 1933.
Interior spreads from L'œil raisonné. Images taken from analysis of urban Amsterdam and Paris, presented at CIAM IV, Athens, in 1933.
Cartographic work is a process marked by the persistent gap between the map and the subjects who produce it; and it is in this space, well-illustrated in Chapel's research, in which shifts in paradigms are introduced.
Antonio di Campli

Latest News

Latest on Domus

Read more
China Germany India Mexico, Central America and Caribbean Sri Lanka Korea icon-camera close icon-comments icon-down-sm icon-download icon-facebook icon-heart icon-heart icon-next-sm icon-next icon-pinterest icon-play icon-plus icon-prev-sm icon-prev Search icon-twitter icon-views icon-instagram