States of Design 01: Visualization

In a new series, the design curator of MoMA reflects on the status of central design disciplines today. The first installment reflects on the currency of visualization design.

This article was originally published in Domus 946, April 2011

In the past 20 years, design has branched out in many new directions that have galvanised young practitioners, sparked business models, and set the worldwide education system on academic fire. There are many different ways in which one can be a designer today, working for instance on interactions, interfaces, the Web, visualisations, typefaces, socially-minded infrastructures, 5D spaces, sustainability, games, critical scenarios, and yes, even products and furniture. In the coming decades, the rest of the world will catch up and design will be embraced as a methodology and philosophy by politicians, scientists and economists who are willing to have a human, holistic and constructive perspective on the world. With this series of articles, we ponder how far designers have come and how far they still have to go to be ready, one design type at a time.

It is correct to credit the digital revolution with the seismic shake-up that is redrawing the design universe, but many other strong forces are at work. The awareness of the scarcity of resources and of the toll our living habits are taking on the environment are slowly leading us to cut down on physical possessions. Some of the fulfillment and escape we used to attain by giving in to our guilty consumeristic pleasures has been absorbed by the experiences—even consumption ones—that we can have online. And the armies of designers, engineers and entrepreneurs working on the liminal spaces inside our screens rely on their skills and on cognitive science to craft environments that integrate and expand our life on earth. Visualisation design is crucial to this integration.

Visualisation design has existed since the beginning of time, a direct expression of our desire to understand, describe and bring complex phenomena down to human scale. Maps and diagrams are its most obvious manifestations, and the history of modern visualisation design has its well-known milestones—such as Charles Joseph Minard's 1869 schematics of Napoleon's and Hannibal's military campaigns, John Snow's 1854 diagrammatic reading of a cholera epidemic in London (which demonstrated that cholera is a water-borne disease), or Harry Beck's immortal 1933 map of the London Underground—and chroniclers, such as Edward Tufte and Peter Hall. While maps and diagrams are classic examples, visualisation also comes in the form of installations and dynamic narratives, such as Charles and Ray Eames's 1968 film Powers of Ten and their installation Mathematica of 1961.
Ben Fry, <i>Disarticulate,</i> 2004 (courtesy of Ben Fry)
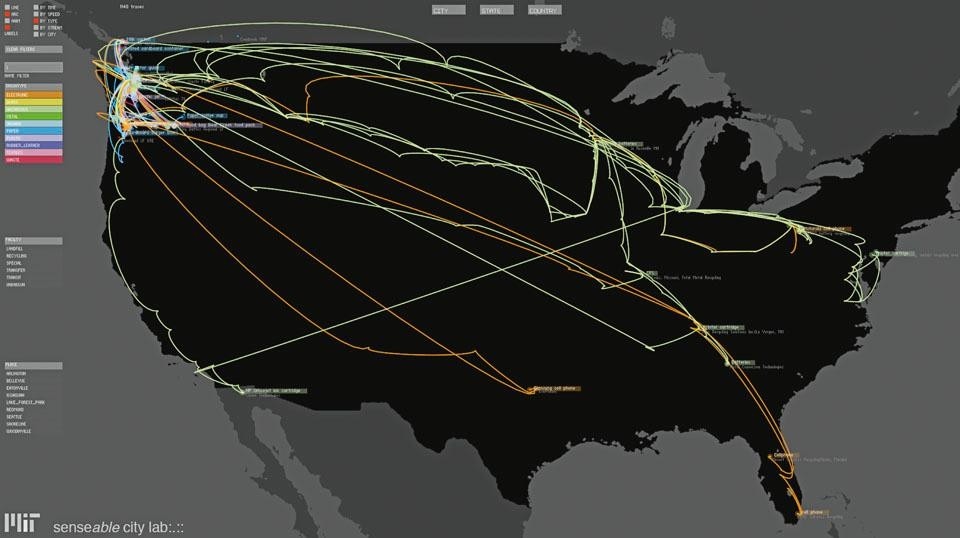
. Top: <i>Track Trash.</i> SENSEable City Laboratory at MIT: The project aims to increase awareness of the impact of waste transit.
Ben Fry, Disarticulate, 2004 (courtesy of Ben Fry). Top: Track Trash. SENSEable City Laboratory at MIT: The project aims to increase awareness of the impact of waste transit.
Visualisation design is today in rapid expansion, relying on more frequent direct collaborations between designers and scientists and trying to keep up with an ever-growing computational power that churns out raw data at astounding speeds. Besides strong graphic-design skills, however, working with data in an Internet-savvy world also requires a strong sense of space and time, as well as the gift of synthesis. That is why so many architects and designers are trying their hand at this new form of communication, also as an alternative to making and building in the physical world, where both the economic and the environmental crises are limiting their work. The examples on these pages represent the highest quality of design in a range of different topics and stand in for many others as paragons. All but one, that is. Please get acquainted with a memorable 2010 diagram of the American strategy in Afghanistan, prepared for General Stanley A. McChrystal and hailed by Elisabeth Bumiller as an example of how not to visualise information.[1]

In the past decade, Ben Fry has set the benchmark against which all ambitious designers need to measure themselves. Fry graduated from MIT Media Lab's Aesthetics + Computation group at the time when John Maeda was continuing the legacy of the great and late Muriel Cooper (the programme's founder), and his undeniably gorgeous projects are visualisations of highly complex data sets. His work ranges from collaborations with scientists on, for instance, protein homology, to speculative analyses of dynamic correlations, such as the one between a website's evolution and its usage, or between the lines of code behind Pac-Man. Fry has single-handedly demonstrated what David McCandless transformed into a motto—and a website and book—which proclaims, information is beautiful, even when it is esoteric. In his quest to provide new tools for talented designers who are unafraid to be elegant, Fry together with his Media Lab colleague Casey Reas developed Processing, an open-source programming language based on Java. Simple enough to be picked up by non-programmers and sophisticated enough to be used for high-level design, architecture, visualisation and animation projects, Processing has already had a significant impact as a powerful and inspiring design tool.
Ben Fry, <i>Disarticulate,</i> 2004 (courtesy of Ben Fry).
Ben Fry, Disarticulate, 2004 (courtesy of Ben Fry).
Commissioned by the Fondation Cartier pour l'art contemporain, in Paris as part of a 2008 exhibition entitled Terre Natale and realised by a stellar team of architects, designers and programmers, Exit is a testimony to the political power of design. It was conceived to illustrate curator and cultural theorist Paul Virilio's belief that "humanity is now defined by migration". Through a series of six panoramic data-visualisation narratives displayed over the course of forty-five minutes on a round screen, the installation "quantifies both voluntary and forced movement across the globe due to political, economic and environmental factors". In one instance, a glowing map of the world is projected onto the walls, with blooms of light indicating relative responsibility for carbon emissions aggregated by population density; in another, remittances (money sent back by a migrant labourer to his or her nation of origin) are tracked by country, demonstrating that in some nations total remittances received exceed foreign aid. The design of the theatre and installation was such that viewers were literally wrapped in a universe of information, transmitting a sense of both global scale and immediacy that is lacking when these facts are presented through the usual media channels.
Good visualisation design, one of the most promising and important forms of contemporary practice, helps merge quantitative and qualitative by giving data a sensual, aesthetic and therefore humanly communicative face.
Exit: Carbon Emissions Map. Diller Scofidio + Renfro, Laura Kurgan, Mark Hansen and Ben Rubin with Stewart Smith and Robert Pietrusko. www.nativeland-stopeject.com.
Exit also presented innovative ways of fusing data and geography in dynamic, multidimensional maps. From global to intimate, every year information designer Nicholas Felton publishes his own annual report (under the name Feltron, which sounds more corporate) with the same care and elegance that corporations pour into their ultimate publicity and investor-seeking tool. He even publishes, gulp, an old-fashioned, nostalgic and wasteful dead-tree version (that's "printed on paper" in green activist parlance). His first report came out in 2005. While his 2009 report once again covered his life, his 2010 edition was instead devoted to his father, who passed away in September of the same year. One of the best-designed websites in years, we feel fine by Jonathan Harris and Sep Kamvar (defined as "an exploration of human emotion, in six movements) scans the Internet looking for all words related to the root "feel" from all over the planet. The data are then rendered in a searchable manner that includes geographic, meteorologic, age- and gender-based criteria, and visualised in beautifully designed diagrams and tables.

The abundance of interactive and open-source maps has inspired many designers to cull information and layer it on top of them for different purposes, from leisure tourism to emergency management. Here are four notable examples. Locals and Tourists uses geo-tagging data from the photosharing websites Flickr and Picasa to pinpoint tourist hotspots and locals-only stomping grounds in 126 cities—Milan, New York and Salzburg among them. After harvesting millions of data points, Eric Fischer links them by photographer and date taken and then plots them on a city's OpenStreetMap grid. A photographer with many shots of the same city and a long photo history can be assumed to be a local and is represented in blue; someone whose photos are taken within a limited time period is assumed to be a tourist and represented in red.
<i>Feltron, 2010 Annual Report</i>. The sixth volume in the series,
printed in an edition of 3,000
copies, is designed and selfproduced
by Nicholas Felton
(courtesy of Nicholas Felton).
Feltron, 2010 Annual Report. The sixth volume in the series, printed in an edition of 3,000 copies, is designed and selfproduced by Nicholas Felton (courtesy of Nicholas Felton).
A project by the SENSEable City Laboratory at MIT, TrashTrack delineates the invisible infrastructures of urban trash removal, in its path from garbage can to waste-processing facility. Waste products in New York, Seattle and London were tagged with custom-designed, non-toxic chips and the signals from the tags were overlaid in real time onto satellite maps to demonstrate the objects' physical path, which is often more complex, counter-intuitive and wasteful than we can imagine. To raise awareness, SENSEable City Lab exhibited the project's results in Seattle and New York in 2009.
<i>We Feel Fine.</i> “The most common feelings
overall” according
to the almanac of human
emotion by Jonathan Harris
and Sep Kamvar. www.wefeelfine.org
We Feel Fine. “The most common feelings overall” according to the almanac of human emotion by Jonathan Harris and Sep Kamvar. www.wefeelfine.org
BBC Dimensions, designed by berg, overlays landmark events and phenomena onto a satellite view of your own city or neighbourhood, literally "bringing home the human scale of events and places in history". Users pick among a series of events, places and things—ranging from the blueprint of the Pyramids of Giza to the area affected by the Battle of Stalingrad to the depth of the Marianas Trench—and type in the zip code they wish to use to compare. Some dimensions can be printed out as walks to allow for an even more physical appreciation of the distances involved. In this way, BBC Dimensions renders history and current events more tangible and immediate, bridging both physical and conceptual distance.
Eric Fischer,
<i>Locals and Tourists #8
(GTWA #24): Seattle.</i>
(base map © OpenStreetMap,
CC-BY-SA)
Eric Fischer, Locals and Tourists #8 (GTWA #24): Seattle. (base map © OpenStreetMap, CC-BY-SA)
Ushahidi, which means "testimony" in Swahili, is perhaps the least visually self-conscious example in our small selection, but its social impact is such as to transcend all judgment. "A free web-based tool that anyone can use for information collection, visualisation and interactive mapping", it was launched in Kenya during post-election violence in 2008. At the time, the site enabled everyday citizens to report riots, incidents and safe spaces using only their mobile phones, effectively building a corps of 45,000 "citizen journalists"; the data was then aggregated and mapped on a website for all to see and respond to, applying the logic of crowdsourcing to crisis management and humanitarian work. Since then, Ushahidi has grown into an open-source platform used worldwide in times of crisis and has proven to be a vital tool in vastly different contexts, from the 2010 earthquakes in Haiti and Chile, to a winter storm in Washington, D.C., and the 2011 earthquake and tsunami in Japan.
The project by SENSEable City Laboratory at MIT
aims to raise awareness of how garbage impacts the environment. www.senseable.mit.edu/trashtrack
The project by SENSEable City Laboratory at MIT aims to raise awareness of how garbage impacts the environment. www.senseable.mit.edu/trashtrack
The diatribe on the more effective use of quantitative versus qualitative data to describe human behaviour is an old one, but mathematics has recently gained a lot of ground, helped also by the success of massive algorithm-based systems like Google. Good visualisation design, one of the most promising and important forms of contemporary practice, helps merge quantitative and qualitative by giving data a sensual, aesthetic and therefore humanly communicative face. The enthusiasm in the design field can be gauged by looking at websites like visualizing.org, which provides a common platform to the community of students and professionals that are looking for data sets and terms of comparison to test their viz chops. Visualisation design engages synthetic and visual skills, and like prose, it can be calibrated to be journalistic and universally understandable, or it can be rendered with scholarly conciseness and a self-important lack of visual indulgence. But when it is good, visualisation design can be as lyrical as poetry—not just as good as the data it is based on, but actually better.
Paola Antonelli

NOTES [1] Elisabeth Bumiller, "We Have Met the Enemy and He Is PowerPoint," in The New York Times, 26 April 2010.
OpenStreetMap Japan -
Crisis Mapping Project
powered by Ushahidi
Software. (courtesy of Ushahidi).
www.sinsai.info/ushahidi
OpenStreetMap Japan - Crisis Mapping Project powered by Ushahidi Software. (courtesy of Ushahidi). www.sinsai.info/ushahidi

Latest on Design

Latest on Domus

Read more
China Germany India Mexico, Central America and Caribbean Sri Lanka Korea icon-camera close icon-comments icon-down-sm icon-download icon-facebook icon-heart icon-heart icon-next-sm icon-next icon-pinterest icon-play icon-plus icon-prev-sm icon-prev Search icon-twitter icon-views icon-instagram